|
|
|

 |
|||||||
|
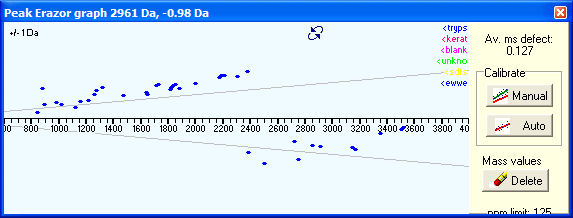
When PeakErazor starts, the graph window will by default always show the deviation vs. mass graph. You switch to the Mass defect view either by pressing the button in the center at the top of the graph, or you right-click and select ‘Mass defect view’ from the pop-up graph. |
|||||||
 |
|||||||
|
If the mass defect spreads to both sides of the x-axis (as in the example above) you have to do a manual calibration first: press Manual then click at one end of the line of dots (use the low mass area) then pull line to the other end of the dots, following the same direction as the dots. Click once again, and the dots should all be centered around the x-axis. You can now press the Auto button, and all dots will be used for a linear calibration and you can now copy the calibrated peak list back onto the clipboard. If dots fall outside of the +- 125 ppm limit, they are likely to be non-peptide contaminants (matrix, adduct ions) and can be deleted through the Delete button. Perform another round of automatic calibration after deleting peaks. You have two controls to adjust how the mass defect works: Slope and Offset. |
|||||||
|
Site last updated: February 14, 2025 |
|||||||