|
E – Getting data out of GPMAW
In a field as varied as protein chemistry, it is not possible just to use a single rather specialized program like GPMAW for all your protein analyses. Particularly when using the Internet with the ready availability of (free) programs, it is of interest to be able to quickly and efficiently transport protein sequences around. Another aspect is the handling of larger projects, where you typically use a word processor or spreadsheet to keep track of your data. For these programs, GPMAW also have some functions that enable you to do as little handling as possible in the target program.
1 – Protein sequence.
The most obvious way of getting a sequence from GPMAW to a report is to copy to the clipboard.
Select the sequence window you want to copy, press Ctrl-C or select Edit|Copy to clipboard. GPMAW shows a timed dialog box (the box is on screen for a few seconds and terminates automatically) telling you that the sequence has been copied. This operation copies the sequence to the clipboard in the format on screen (1- or 3-letter code).
Note: If you have one or more peptides (regions) highlighted, only those portions of the sequence will be copied to the clipboard! Different highlighted regions will be copied as separate lines.
When you paste a sequence into a report, you should in most cases select a monospaced font for display, as the sequences will line up correctly eg.
- Courier
- AGSYLLEELFEGHLEKECWEEICVYEEAREVFEDDETTDE 40
FWRTYMGGSPCASQPCLNNGSCQDSIRGYACTCAPGYEGP 80
NCAFAESECHPLRLDGCQHFCYPGPESYTCSCARGHKLGQ 120
- Arial (Swiss)
- AGSYLLEELFEGHLEKECWEEICVYEEAREVFEDDETTDE 40
FWRTYMGGSPCASQPCLNNGSCQDSIRGYACTCAPGYEGP 80
NCAFAESECHPLRLDGCQHFCYPGPESYTCSCARGHKLGQ 120
Although the Arial font is nicer to look at, it is much more difficult to find you way around a sequence. If you export in the detailed mode, things get really screwed up unless you choose a monospaced font.
The method above has one disadvantage: you only copy the sequence and not the name. In order to include the name you have to ‘export’ the sequence.
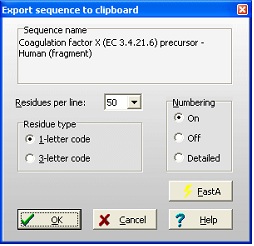 Select File|Export sequence|To clipboard. This opens the dialog shown on the right. Here you have a number of options to format the output to fit with your report. The Residues per line is a dropdown box that lets you select from 10 to 100 residues per line. The Residue type is set as your screen display, but can be changed. Numbering can be selected On (see example above), Off (no numbers) or Detailed: Select File|Export sequence|To clipboard. This opens the dialog shown on the right. Here you have a number of options to format the output to fit with your report. The Residues per line is a dropdown box that lets you select from 10 to 100 residues per line. The Residue type is set as your screen display, but can be changed. Numbering can be selected On (see example above), Off (no numbers) or Detailed:
Protein Z - Bovine (396 res.)
10 20 30 40
AGSYLLEELFEGHLEKECWEEICVYEEAREVFEDDETTDE
50 60 70 80
FWRTYMGGSPCASQPCLNNGSCQDSIRGYACTCAPGYEGP
90 100 110 120
NCAFAESECHPLRLDGCQHFCYPGPESYTCSCARGHKLGQ
The FastA button puts a ‘>’ in front of the name (e.g. ‘> Protein Z – Bovine’), selects 60 residues per line, 1-letter code and numbering off. This makes it easy to copy a FastA formatted sequence to another program (e.g. on the Internet).
When you click ‘OK’ the sequence is copied to the clipboard.
The annotation page has a small trick when copying to the clipboard. If you select the Edit|Copy to clipboard or Ctrl-V command you will always get the whole annotation copied. However, you can copy part of the annotation by highlighting the relevant portion, right-click in the window and select the ‘Copy’ command from the pop-up menu.
2 – The peptide list.
The peptide list is the result of the cleavage of a protein. It is one of the main features of GPMAW. This is mainly due to the fact that although the primary structure of a large number of proteins is known (mostly based on nucleotide data), the analysis of intact proteins is still very difficult. Thus you have to cleave the protein into specific smaller fragments, peptides, using specific enzymes or chemicals. Although the calculation of chemical/physical parameters like mass, pI and HPLC retention times is possible, either by hand or programs freely available on the web (e.g. www.expasy.ch), these programs are often cumbersome to work with and are often not designed for the mass spectrometrist.
The generation of the peptide list is fairly straightforward, and will not be covered here (see the manual and online help for more details).

Once generated you may sort the list based on any of the displayed parameters by clicking on the header. The first click will sort in descending order, while clicking a second time will sort in ascending order.
Pressing Ctrl-C or selecting Edit|Copy to clipboard (or from the pop-up menu) will copy the entire content to the clipboard.
The copy will be just like the list displayed, so you should make sure the sorting, monoisotopic / average mass, 1-/3- letter code etc. is correct before copying.
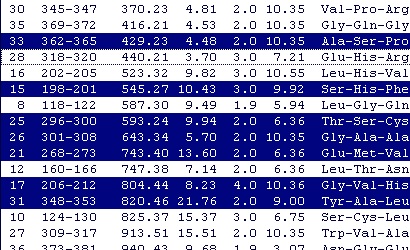 You may copy only part of the list by selecting only some lines. You can select a continuous range of entries by clicking on the first one and holding down ‘Shift’ while clicking on the last one. If you hold down ‘Ctrl’ you can add and remove single entries from the selection. If you start by selecting a continuous stretch, you can add and remove single entries afterwards. You may copy only part of the list by selecting only some lines. You can select a continuous range of entries by clicking on the first one and holding down ‘Shift’ while clicking on the last one. If you hold down ‘Ctrl’ you can add and remove single entries from the selection. If you start by selecting a continuous stretch, you can add and remove single entries afterwards.
When you want copy only part of the list, you have to select at least two peptides, as GPMAW will otherwise just go ahead and copy the whole list.
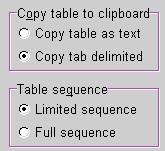 Two entries in the Peptide|Setup are important when copying: copy as text vs. tab delimited and copy full sequence vs. limited sequence. Two entries in the Peptide|Setup are important when copying: copy as text vs. tab delimited and copy full sequence vs. limited sequence.
When you copy as text, each column is separated from the next by a space character. This makes it easy to align columns if you use a monospaced font (e.g. Courier). If you select ‘tab delimited’, each column is separated from the next by a ‘tab’ character. This means that you have to set the tabs properly in the report. E.g.
Table as text delimited (Courier font):
Num From-To Mass HPLC Ch pI Sequence
33 362-365 429.23 4.48 2.0 10.35 Ala-Ser-Pro-Arg-
28 318-320 440.21 3.70 3.0 7.21 Glu-His-Arg-
16 202-205 523.32 9.82 3.0 10.55 Leu-His-Val-Arg-
15 198-201 545.27 10.43 3.0 9.92 Ser-His-Phe-Arg-
Table as tab delimited (Arial font):
Num From-To Mass HPLC Ch pI Sequence
33362-365 429.23 4.48 2.0 10.35 Ala-Ser-Pro-Arg-
28 318-320 440.21 3.70 3.0 7.21 Glu-His-Arg-
16 202-205 523.32 9.82 3.0 10.55 Leu-His-Val-Arg-
15 198-201 545.27 10.43 3.0 9.92 Ser-His-Phe-Arg-
When you copy columns to a spreadsheet (e.g. Excel) you should always use the ‘Copy tab delimited’ as this will transfer columns to individual columns. You can set your spreadsheet up to accept space-delimited columns, but this is fraught with errors.
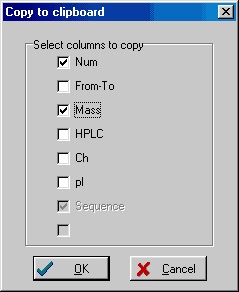 Instead of copying the complete table, you may be interested in only copying a few of the columns. You could go into Peptide|Setup and change the layout of the peptide table, but it is much easier to right-click in the table and select Instead of copying the complete table, you may be interested in only copying a few of the columns. You could go into Peptide|Setup and change the layout of the peptide table, but it is much easier to right-click in the table and select
Copy/Export|Copy columns to clipboard
from the pop-up menu. In the copy to clipboard dialog box, you can then select the columns to copy. The title for each tick-box is taken from the actual header of the peptide table. The ‘Sequence’ column is always selected.
Like when copying the complete table you can select a range of peptides before you start the copy operation.
3 – Mass search results
The results of a mass search are reported in a two-page window. The first page (Analyze) displays the ‘hits’ in a tabular format that enables you to fine-tune the results by changing the displayed properties, change precision, perform recalibration etc. The second page (Report) displays a report based on the selections made on the first page.
Copying the results presented on the first page works very much like the peptide list described above. The main difference lies in the selection of lines to report. Where the peptide list is a standard multiple selection list, the results of the mass search is a check box selection list.
This works in the way that if no lines have been selected (checked) the whole list is copied. If one or more lines have been checked you are asked whether you want only the selected lines copied (Yes – selected lines only; No – whole list; Cancel – cancel copy operation).
The ‘Check’ button atop the check boxes, works to check/uncheck all lines in a single operation.
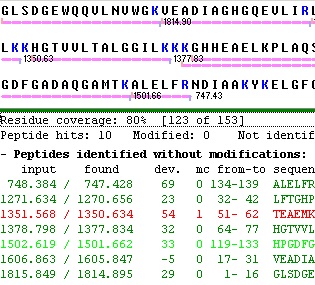 The individual check boxes can be checked/unchecked by clicking on them with the left mouse button. Alternatively you can use the arrow keys to move up and down the list and use the space bar to check/uncheck lines (usually faster than using the mouse). The individual check boxes can be checked/unchecked by clicking on them with the left mouse button. Alternatively you can use the arrow keys to move up and down the list and use the space bar to check/uncheck lines (usually faster than using the mouse).
A shortcut exists in the pop-up menu to check all peptides that fits with the cleavage pattern of the enzyme used in the search (Selected peptides|Check perfect fits). Another option inverses all selections (e.g. unchecks all checked items and visa versa - Selected peptides|Toggle selections).
Unlike the peptide list, you cannot select individual columns for transfer.
Depending on how you make out your report and whether you copy to a spreadsheet, you have to set the Peptide|Setup correctly (see ‘Peptide list’ above).
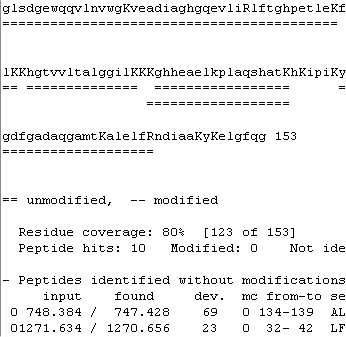 The second page (Report) contains two scroll boxes, where the top one displays the sequence, and the bottom one statistics and the identified peptides. The top box shows the sequence and the identified peptides in color, which are not preserved when copied to the clipboard. Here the format changes to show the sequence in lower case with the cleavage residues (blue on screen) in upper case. The identified peptides are shown as double underlines. The second page (Report) contains two scroll boxes, where the top one displays the sequence, and the bottom one statistics and the identified peptides. The top box shows the sequence and the identified peptides in color, which are not preserved when copied to the clipboard. Here the format changes to show the sequence in lower case with the cleavage residues (blue on screen) in upper case. The identified peptides are shown as double underlines.
Although some information and the easy navigation of the screen is lost most of the essential information is transferred. Note: you can copy the coverage map presented below for a much clearer display.
4 – Presenting sequence coverage.
 One of the common and tedious jobs for a protein chemist (except for presenting 1500 annotated ms/ms spectra as an appendix) is to present the sequence coverage of an enzyme digest in order to show that you have done a good job in characterizing a given protein. One of the common and tedious jobs for a protein chemist (except for presenting 1500 annotated ms/ms spectra as an appendix) is to present the sequence coverage of an enzyme digest in order to show that you have done a good job in characterizing a given protein.
In GPMAW you get a sequence coverage when performing a mass search (see previous section), but this coverage has a couple of shortcomings:
1) Beauty is not one of its main attributes, as it is meant for ease and compactness
2) Often you have additional information you may want to incorporate (e.g. you may find additional peptides manually or you may have multiple digests that you want to combine in a single figure).
In addition to the primitive ‘automatic’ coverage above, GPMAW have the option to make nice coverage maps, which can easily be edited and exported to reports, both in Word, PowerPoint and other programs.
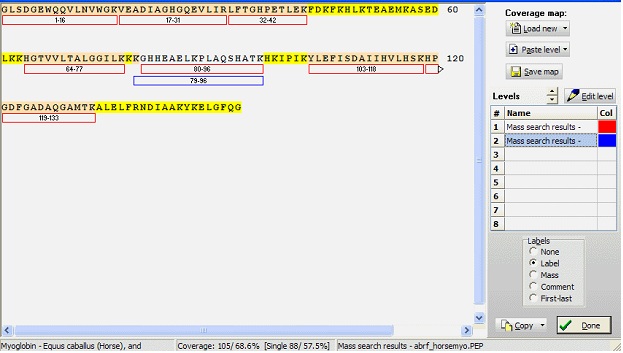
A coverage map in GPMAW consists of a sequence and up to eight levels. Each level consists of a number of peptides, each of which is defined by first and last residue number. The numbering (and thus the level) is not tightly coupled to a sequence, so you have to be careful not accidentally to paste a level into the wrong sequence. Each peptide may further have a label (16 characters) and a comment (40 characters). The peptide mass is not saved along with the peptide in the coverage map, but is calculated based on the sequence, current mass file, and the peptide limits. Furthermore, each level has an associated color that can be edited form the ‘Edit level’ dialog box.
To work with a coverage map you select Utilitilies| Coverage analysis from the main menu, which opens a window with a large empty field and a right-hand toolbar.
Starting a coverage map:
 Manually: Click on the down-arrow in the ‘Load new’ button. From the drop-down menu select ‘Sequence from desktop’, and you can now choose any sequence that is currently open on the desktop. Manually: Click on the down-arrow in the ‘Load new’ button. From the drop-down menu select ‘Sequence from desktop’, and you can now choose any sequence that is currently open on the desktop.
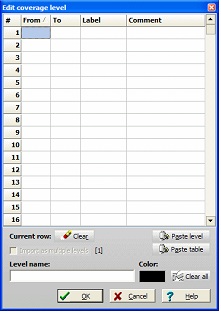
Select a level in the ‘Levels’ table and click on the ‘Edit level’ button. This opens a dialog box with a table where you can enter start, end, label, and comment for each peptide.
As this is rather tedious, and as you are likely to have the data on electronic form anyway, a number of shortcuts are available.
If you have copied an intact level to the clipboard from the mass search window, you can paste it using the ‘Paste level’ button.
It is usually more interesting to import a table from most tabular listings:
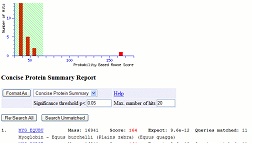
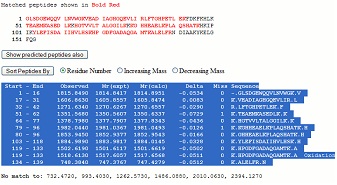 Making a peptide mass fingerprint search using the Mascot search engine (www. matrixscience.com) you may get a result like this with a clear hit. Making a peptide mass fingerprint search using the Mascot search engine (www. matrixscience.com) you may get a result like this with a clear hit.
Load the protein in question into GPMAW (use the accession number to retrieve it from the Internet, or copy and paste from the detailed information window).
Click on the sequence accession number link, and from the ‘detailed information’ window, you now highlight and copy the table to the clipboard:
Go back to GPMAW and press the ‘Paste table’ in the ‘Edit coverage level’ dialog. GPMAW will now parse the table into columns in a new dialog box. In order to import the table, you have to define the column that contains the ‘from’ and ‘to’ values. This is done through the spin edit controls in the right-hand panel. GPMAW will make a guess (first integer column as ‘from’ and the second as ‘to’) and the selected columns will be highlighted. The label and comments can also be selected as columns.
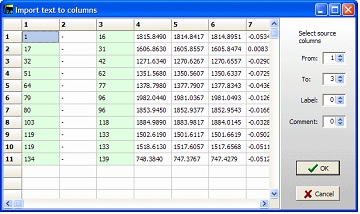 Select ‘OK’ to transfer to the Edit level dialog. If the peptides overlap, you have the option of dividing the peptides into separate levels. The different levels are indicated by different colors in the Edit level dialog. Note that only three levels can be created this way. However, if the third level contains overlapping levels, you can edit this level to create multiple levels (if levels are available). Select ‘OK’ to transfer to the Edit level dialog. If the peptides overlap, you have the option of dividing the peptides into separate levels. The different levels are indicated by different colors in the Edit level dialog. Note that only three levels can be created this way. However, if the third level contains overlapping levels, you can edit this level to create multiple levels (if levels are available).
When you have a coverage map, as in the example above, the calculated coverage in residues and in percent is displayed in the footer. The first value is in residues, and the second is in percent. In sharp parenthesis the single peptide coverage values are displayed. The sequence is coloured according to coverage: Yellow: no coverage, red: single coverage, white: multiple coverages.
If you copy the coverage to the clipboard, you can paste it directly into Word, Powerpoint and other programs that accept vector formats. As it is a vector display, you can scale it without loosing any resolution (i.e. magnifying the picture will not end in large pixels). Furthermore, in Powerpoint you can ungroup the picture after converting it into a Microsoft Office drawing (just right-click and select ‘Grouping|Ungroup’). You then have complete control over text and drawings and can add any kind of embellishment you like, i.e. changing the color of individual residues, adding circles, arrows etc. Remember to re-group the picture when done as the picture otherwise easily becomes ‘un-stuck’.
Other ways of obtaining a sequence coverage: From the peptide window, you can save a coverage map of the entire peptide digest – right-click in the window and select ‘Copy special’ from the pop-up menu and in the resulting dialog box you select ‘Copy as coverage file’.
From the Mass search window you can save the coverage through the ‘Save’ button  on the report page. on the report page.
|